At Kintaba, we know that data is central to your incident response and management journey. This week we're excited to a major update to our reports experience to make it even easier for you to keep up to date with the metrics that matter to you.
Our new reports experience
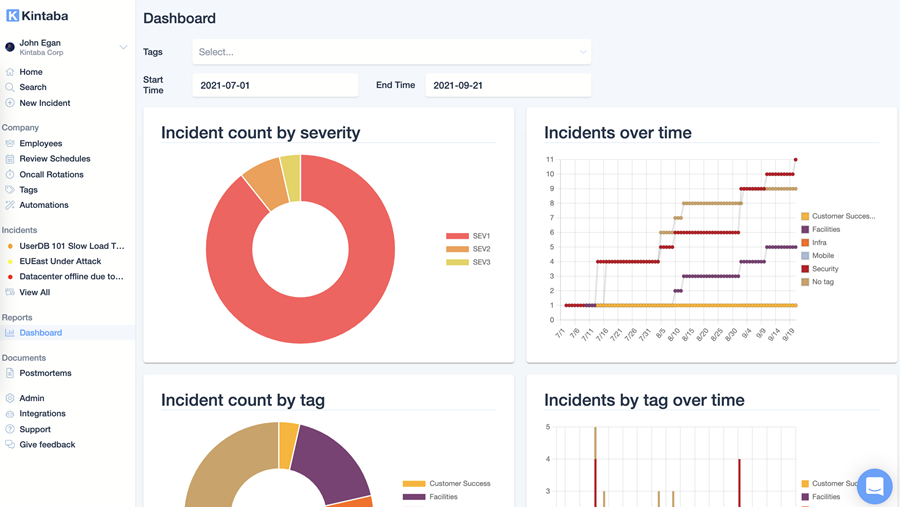
The new experience lets you easily access reports for incident count, incidents by tag, and incidents over time alongside various mean time metrics with a click of a button on a single dashboard.
The incident dashboard can also be quickly limited down to sets of tags and constrained to a date range via the filters at the top of the page.
Check it out in your Kintaba instance's Reports Dashboard and keep you eyes open for new charts and updates to the dashboard as we continue to iterate the dashboard experience.
Have a chart or metric you want included? Let us know!